About me...
I used to be a chartered company secretary but now looking for a change to the data indusrty.
I am a critical thinker, team player, and excellent communicator with a passion for telling stories with data.

I used to be a chartered company secretary but now looking for a change to the data indusrty.
I am a critical thinker, team player, and excellent communicator with a passion for telling stories with data.
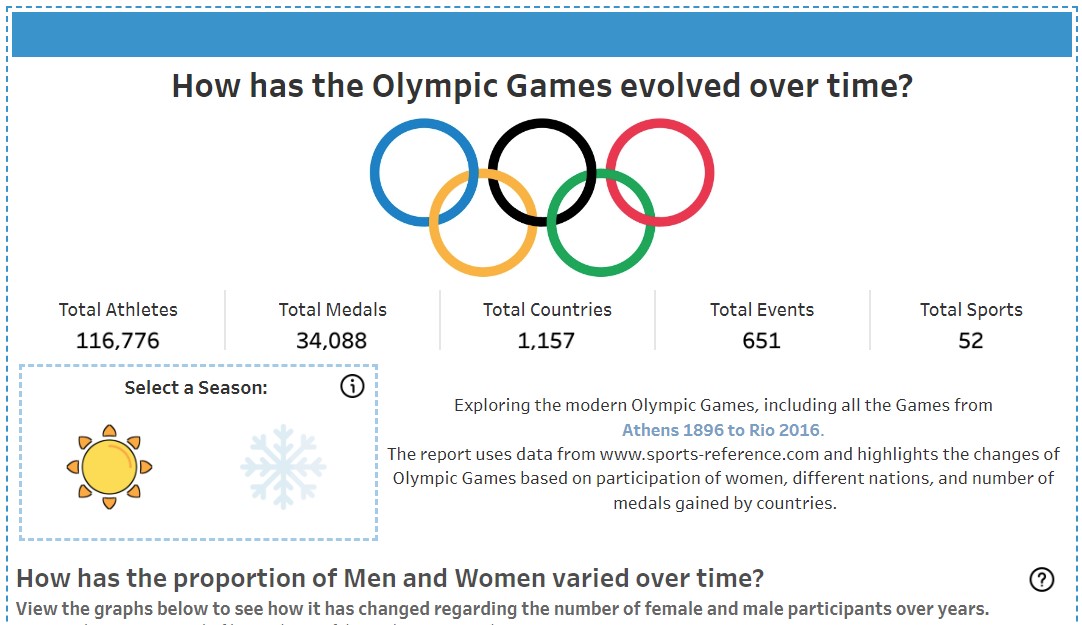
The Olympic Games are one of the world's largest and most prestigious sporting events, with a history dating back to 1896. In this Dashbard, you will find some insights on how Olympic Games evolved in term of promoting the fairness and equality across gender and countries over the years from 1896 to 2016. Click here to go to my Tableau Public for more information!
It is common for those who work in tech industry to have their personal webpage. Today, after watching some online materials and learning some coding languages, my first website have been built! Any new projects will be uploaded to this page!
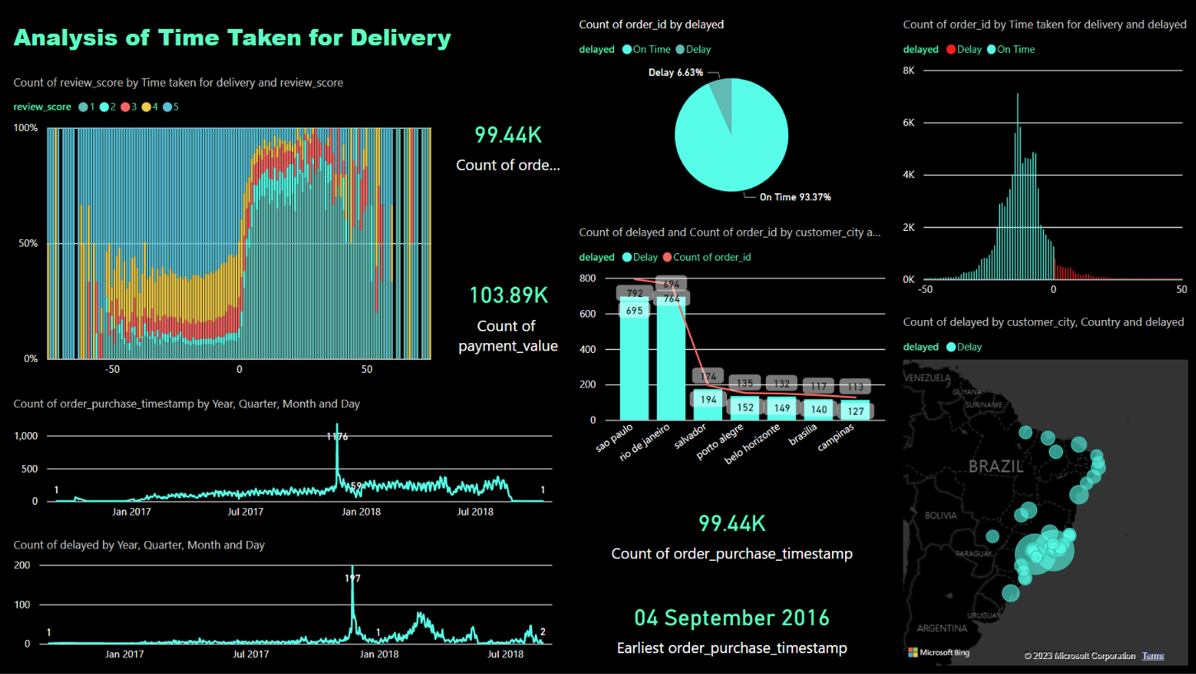
This is a Dashboard created with Power BI showing my findings and insights after maniulated the dateset provided by an online retail company. The purpose of this project was to help the company to increase their customer satisfaction. A presentation has been done in front of audience.

My first personal project which applied my self-taught data manipulation skills. The Netflix and IMDB dataset have been used and combined to give me insights about which movies and TV Shows worth to watch next! Just for fun:)
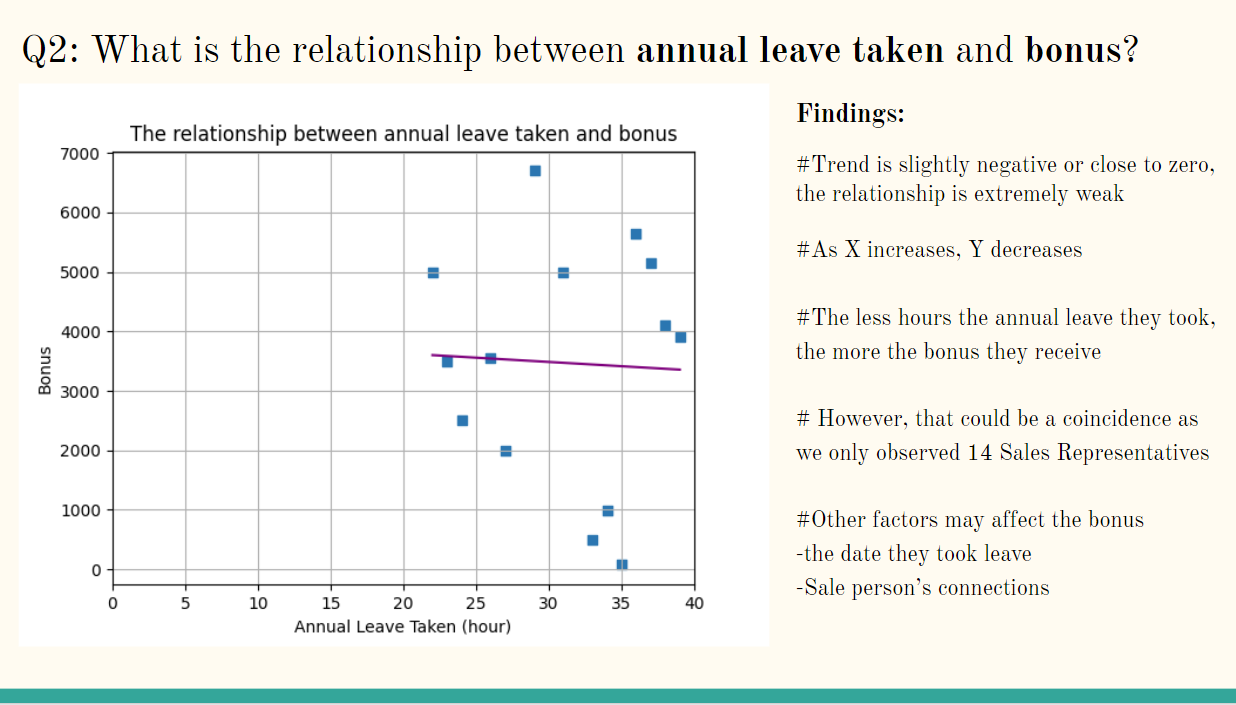
This is a power point slide created with Python and SQL. Useful data have been retrived from a SQL database of a company. The retrived data was then imported to Visual Studio Code to do data cleaning, to build DataFrame using Pandas and to plot different charts using Matplotlib and Seaborn. One of the aims of this project was to help the company to identify the relationsip of two variable using a scatter chart. A presentation has been done in front of audience.
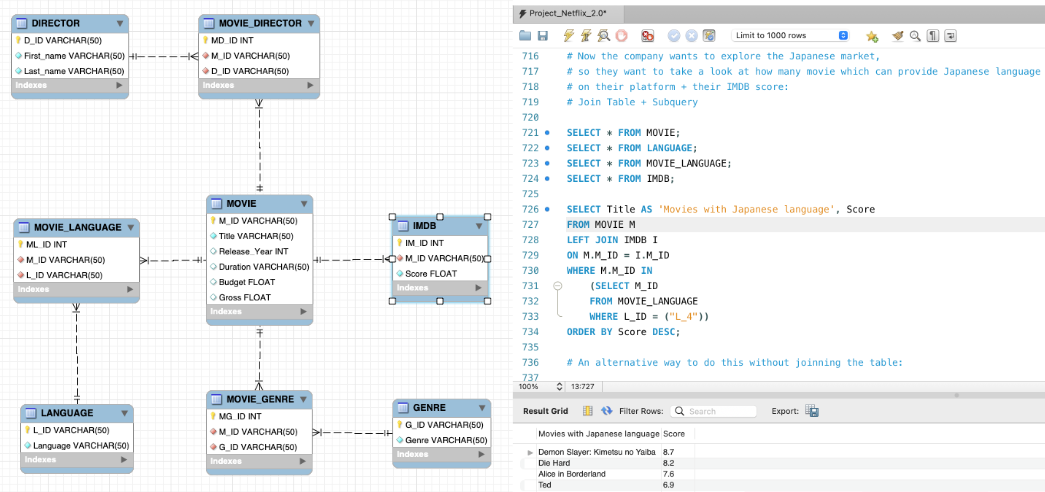
It was an Introduction to SQL course held by Code First Girl. I have an in-depth understanding of SQL and be able to create a database, draw an ER Diagran from tables, write nested queries create a view, stored procedure and stored function.
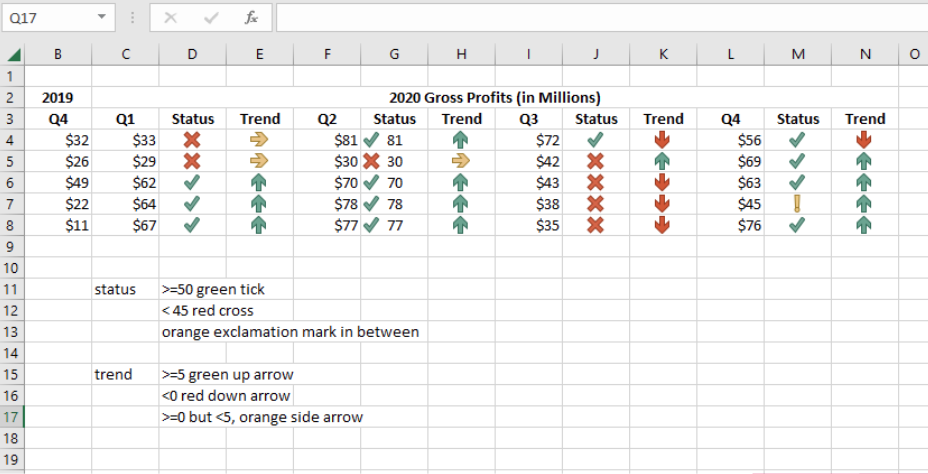
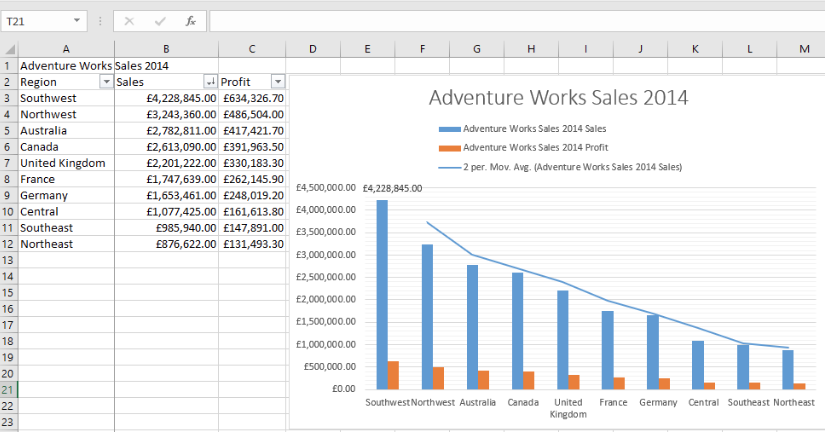
Excel is a very power tool and i have learnt lots of advanced Excel skills in Generation UK and LinkedIn Learning. Creating pivot tables/charts, applying advanced formula/functions, writing Power Query, working on data cleaning and conditional formating....
Similar to Excel but we can do it online!